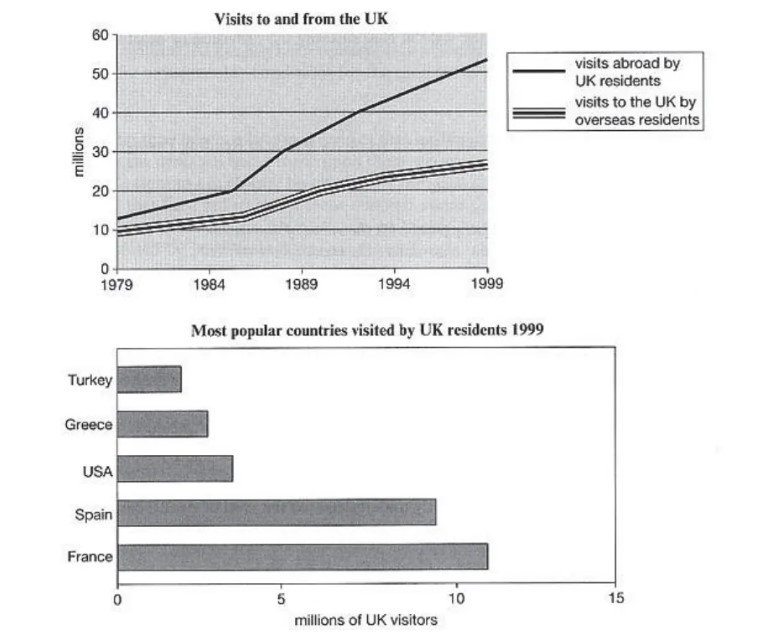
The line graph shows visits to and from the UK from 1979 to 1999, and the bar graph shows the most popular countries visited by UK residents in 1999.
 Sample 1: The Line Graph Shows Visits to And from The UK from 1979 to 1999
The line graph and bar graph illustrate the information about the United Kingdom. Firstly, the line graph generates information about the visit to and from the United Kingdom where the bar graph shows the most famous country visited by the people of the UK.
First and foremost, the visits abroad by UK residents drastically increased from 1979 to 1999. Initially, around 10 million people traveled with the rest of the world. But it is clearly seen that it increased by six times and it is a huge gap of 50 million tourists.
Secondly, in the bar graph, there are five countries given which have been included as the most popular countries visited by the people of the United Kingdom. But France was at the top as nearly 10-15 million people visited it. However, Spain is also leading France as it was visited by 7 to 9 million population of the United Kingdom. Turkey is the least visited country by the people, which is around 1-5 million people.
From the above mention information, it is crystal clear that in 1999 most people visited the rest of the world as a tourist from the UK. Moreover, France was the most popular country to visit by UK residents.
Sample 2: The Line Graph Shows Visits to And from The UK from 1979 to 1999
The given line chart illustrates information about the United Kingdom residents’ visits to other Nations and overseas people visiting the UK in the period of 2 decades between 1979 to 1999, and the bar graph shows the most famous countries visited by UK residents in 1999.
Overall, it is apparent from the very first glance that, after 1985, UK people increased the visit to end. France was a highly visited country by the UK; on the other hand, Turkey was the lowest visited.
Looking at the information in more detail, in 1979, 10 million people visited the UK from other Nations, which was constant until 1984; after that, it escalated rapidly and student 28 million visitors in 1999. Moreover, in 1979 around 12 million you kiss native people visited overseas. Rise at a galloping pace after 1985, reaching 52 million in 1994.
Furthermore, almost 11 million UK visitant visited France in 1999. In contrast, Turkey was the lowest visited country by UK people. Around 9 million UK residents like to go on Spain tours. Greece and the USA were for 4.5 million respectively.
Sample 3: The Line Graph Shows Visits to And from The UK from 1979 to 1999
The table shows information about six different urban areas( London, Paris, Tokyo, Washington DC, Kyoto, and Los Angeles) underground trains, when they opened, how long their tracks are, and how many passengers are traveling per year in a million.
Overall, the table reveals that, despite having a shorter route as compared to London, Tokyo has the highest number of passengers. Another fact is that only London, Paris, and Tokyo have the highest number of travelers.
First, in 1863, London opened its underground railway, and with a 394-kilometer route, 775 million people traveled every year. After that, in 1900, Paris unveiled its underground train, and now they have a 199-kilometer route, and every year about 1191 million passengers travel. In 1927, Tokyo, which inaugurated its underground trains with a 155-kilometer route, now has the highest passenger count, which is 1927 million people per year.
As for Washington, DC, they opened an underground train in 1976, and 144 million people travel the 126-kilometer route yearly. Kyoto opened its underground train in 1981 and only has an 11-kilometer route with 45 million travelers per year, the lowest among other cities. Finally, in 2001, Los Angeles unveiled its subway trains, and now they have a 28-kilometer route with 50 million passengers per year.

Leave a Reply