
The line chart shows average attendance at the cinema among various age groups in the US from 2000 to 2011. summarise the information by selecting and reporting the main features, and make comparisons where relevant.
 Sample 1 The Line Chart Shows Average Attendance At The Cinema Among Various Age
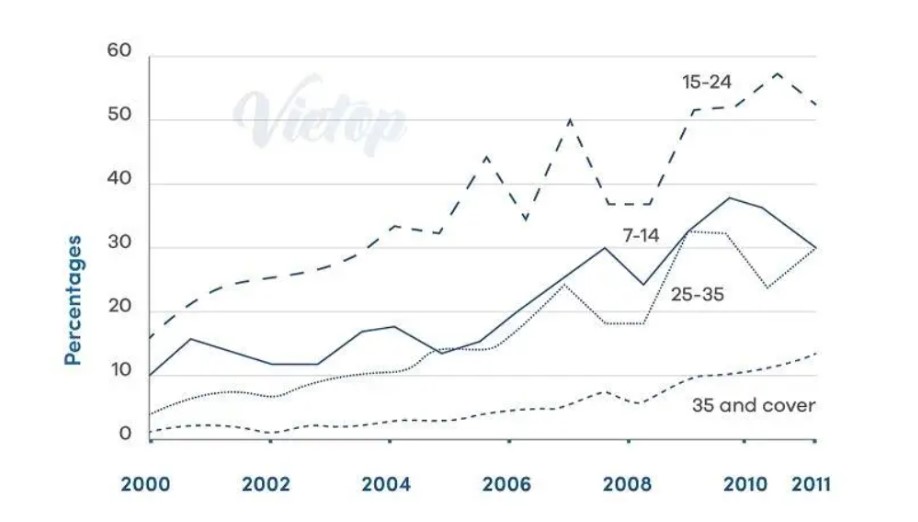
The line graph illustrates how many people from different age groups visited the cinema in the USA between 2000 and 2011.
Overall, visiting the cinema was increasing over time, period teenagers and adults watching movies the most often. At the same time, old people visit fewer cinemas.
To commence with, the 15-24 aged group of people visited the cinema in the beginning, which was 15%, and after that, this aged group showed a drastic upward trend till 2006. In 2007 this group showed a slight decrease and went to 34%. After that adult visiting rate went to an all-time high which was 57%. Moreover, a teenager (7-14) started at 10%and going to 30% in 2008 and ended up at 30% in 2011.
In addition, 25-35 shows a similar trend as a teenager, but this group started with only 5% and went to the same point as the age group 7-14 in 2011. While people who are 35 and above show continuously rising. Started with slightly above zero but ended up with 11% in the year 2011.
Sample 2 The Line Chart Shows Average Attendance At The Cinema Among Various Age
The line chart illustrates the average attendance t the cinema among different age groups like 7-14, 15-24, 25-35, and 35 and covers In the USA from 2000- 2011.
From the figure, the highest attendance in the cinema was found in the age group of 15-24 between 2010-2011, respectively, while the lowest was found in the age group of 35 and above.
Firstly talking about the age group of 15-24, the percentage of the audience is 15% at the beginning of the decade. It increases and comes to 53% at the end of the year 2011, while the number is around 0 percentage for the age group of 35 and covers at the start of the Year 2000, and it steadily increases to approximately 13% at the end of the year 2011.
Secondary talk about the 7 -14 and 25 – 35 age groups start at approximately 10 % and 5 % respectively in the year 2000 but both increase and at the end, it comes to 30% in the year of 2011, but there are ups and downs throughout the year.
Also, Read Write a report for a university lecturer describing the information below
Leave a Reply