
Write a report for a university lecturer describing the information below. You should write at least 150 words. You should spend about 20 minutes on this task.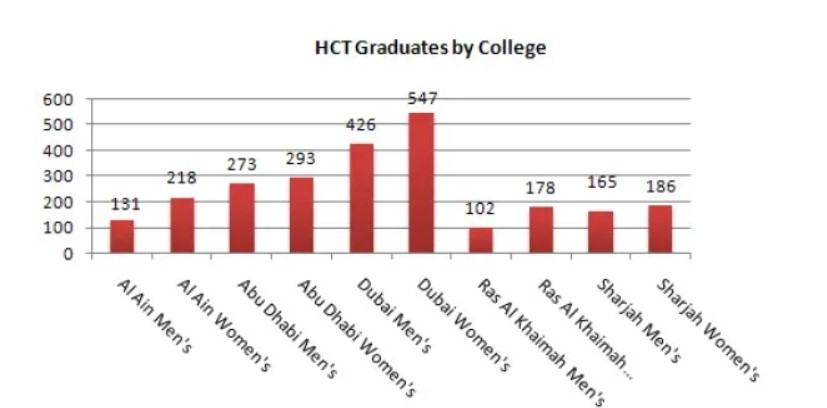
Sample 1: Write a Report for A University Lecturer Describing the Information Below
The bar graph illustrates male and female graduates from the higher colleges of technology colleges in the UAE.
Overall, the maximum number of graduates are women from Dubai, while Sharjah College awards a minimum number of females. Moreover, the highest number of graduates, men, belong to Dubai, while the lowest came from Ras A1 Khaimah College.
To begin with, A1 Ain College awarded a total number of students: 131 were male, and the remaining 218 were female. Apart from this, Abu Dhabi College graduated over there. The highest number of students who graduated from Dubai College was 547 female pupils and 426 male pupils.
Moreover, a total of 280 pupils were awarded by Ras A1 Khaimah College. It was 102 men and 178 women students. Sharjah College awarded approximately the same number of men and women, 165 and 186, respectively. Overall, it was seen the highest awarded pupils were women by higher technology colleges.
Sample 2: Write a Report for A University Lecturer Describing the Information Below
Here, the bar graph illustrates data regarding the number of graduates from HCT College.
The graph is displayed on the x-y axis, and the x-axis shows the number of graduates while the y-axis represents the data of males and females from different countries.
The number of AI Ain men is 131, while AI Ain women are 60 per cent more than the number of AI Ain men, i.e. 218. Abu Dhabi men’s is 273 while the women’s is 293, and the highest number of men’s and women’s graduates are from Dubai, 426 and 547, respectively.
The lowest number of men and women graduates are from Ras Al Khaimah, i.e. 102 and 178, respectively. Again, there is a rise in the number of graduates from Sharjah men’s and women’s, which is 165 and 186.
Also, Read The Pie Charts Show the Electricity Generated in Germany and France From All Sources
Leave a Reply