
The line graph shows the number of first-time visitors and returning visitors who visited Caryl Island from 2000 to 2008. Summarise the information by selecting and reporting the main features and make comparisons where relevant.
 Sample 1:- The Line Graph Shows the Number of First-Time Visitors
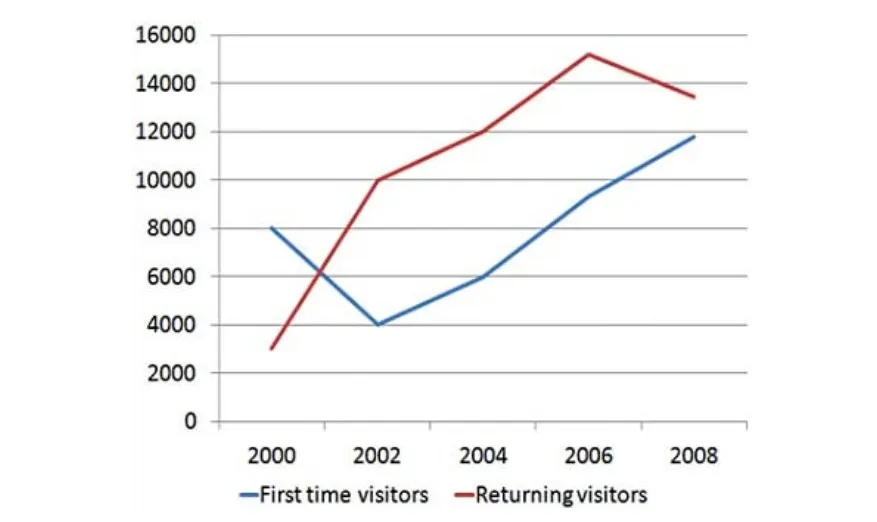
The given line graph represents information regarding how many Travellers visited for the first time in Caryl Island and who returned from the Island from 2000 to 2008. Overall, it can be seen that the number of returning visitors was more than first-time visitors.
At a fleeting glance, it is noticeable that the amount of returning Travellers started from the ratio of 3000 in 2000 then rose steadily over the next two years and reached the amount of 10000. After that, this data continued to incline, approximately 15000 in 2006. However, the number of tourists on Caryl Island began declining over the next two years.
Regarding the preference of first-time visitors, this ratio started from 8000 and declined steadily within the next two years. After that, from 2002 this ratio increased by 2000 in an amount within the next two years and began to climb in the following years and stuck at 12000 visitors but less in amount as compared to Travellers who returned from Island.
Sample 2:- The Line Graph Shows the Number of First-Time Visitors
The line graph depicts the number of people who visited Caryl Islandfrok from 2000 to 2008, that is, both first-time and returning visitors.
From the graph, it can be deduced that the number of people who visited the Island in both categories kept on increasing within the given years.
Follow-Us on Pinterest IELTSPlaza
In the year 2000, the number of first-time visitors reached 3000 but experienced a decline of 4000 in 2002. However, the number of visits was revived two years later and kept on increasing thus, from 6000 in 2004 to about 12000 in 2008.
For returning visitors, there was a low patronage of about 3000 people in the year 2000(considering the figures in the subsequent years). The narrative changed, and the number of visits kept on increasing with a significant difference of 7000 by 2002, reaching its peak of about 15, 000 visitors in 2006, then getting a slight study decline in 2008 with approximately 13, 500 people.
Sample 3:- The Line Graph Shows the Number of First-Time Visitors
The provided line graph illustrates the influx of tourists to Caryl Island between 2000 and 2008, distinguishing between those visiting for the first time and those making return trips. In general, it is evident that the number of returning visitors exceeded that of first-time visitors.
Upon initial inspection, it becomes apparent that the count of returning travelers commenced at 3000 in 2000 and experienced consistent growth over the subsequent two years, eventually peaking at 10000. Subsequently, this trend persisted, reaching an approximate figure of 15000 in 2006. Nevertheless, the count of tourists on Caryl Island underwent a decline over the ensuing two years.
Conversely, concerning the preferences of first-time visitors, their count initiated at 8000 and underwent a gradual decrease within the following two years. Subsequent to this, from 2002 onwards, this count surged by 2000 over the subsequent two years and entered an ascending trajectory in the ensuing years, stabilizing at 12000 visitors. However, this count remained lower than the number of travelers who made return visits from the island.
Leave a Reply