")
The table below shows changes in the number of residents cycling to work in different areas of the UK between 2001 and 2011. Summarise the information by selecting and reporting the main features, and make comparisons where relevant.
Sample 1: The Table Below Shows Changes in The Number of Residents Cycling
The given table chart depicts information about commuting by cycling for work in various parts of the UK by their people in the years 2001 and 2011.
Overall it is apparent from the very first glance that the inner part of London shows the highest difference. On the other hand, in outer London, the lowest difference between both years.
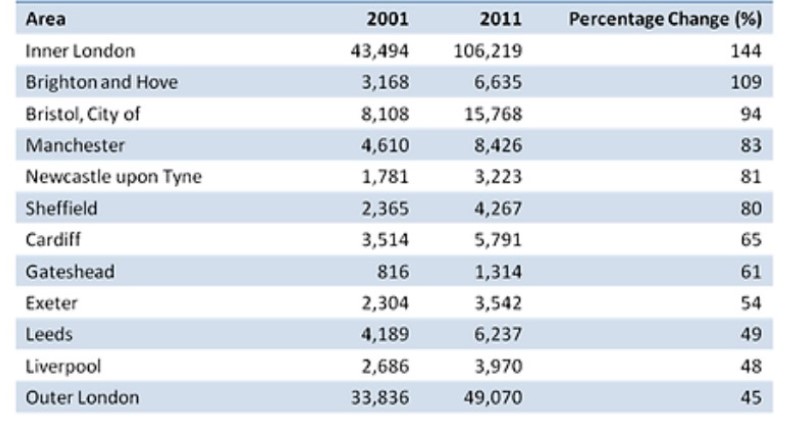
Looking at the information in more detail, inner London had the biggest dissimilarity between 2001 and 2011, 144% respectively, which is the highest throughout the period. Moreover, Brighton and Hove was the second highest place, where people escalated their cycling skills. In 2001 ratio was 3168, and it increased more than doubled in 2011 was 6635. In addition, Newcastle upon Tyne and Sheffield have approximately the same proportion of difference, showing 81% and 80%.
Furthermore, Gateshead lowest number of people who use a cycle for their commute was 816 in 2001, and in 2011, it was 1314; the ratio was inclined to 61%. In Leeds and Liverpool in 2001 4189 and 2686 people used to use a cycle for committing, it increased by around 50% in both cities. Additionally, the outer London part had show lowest difference between the two years, 45% respectively.
Sample 2: The Table Below Shows Changes in The Number of Residents Cycling
The information about the changes in figures of citizens cycling to their workplace in various areas of London from 2001 to 2011 is depicted by rendered table chart. The data is celebrated in percentage.
To outline the striking factor, it can be clearly seen that there was a drastic difference in the number of cycling in inner London, which was the highest, and in outer London, it was the lowest.
To begin with, changes of figures to reach office with cycle in inner London Topped the list with 144%, while Brighton and Hove were second highest with 109%. Bristol, the City of London, was changed numbers of 94%. However, Manchester, Newcastle upon Tyne, and Sheffield were 83%,81%, and 80%, respectively.
Moreover, Cardiff increased by 65%, whereas Gateshead was just lower by 4% compared to Cardiff. Furthermore, Exeter percentage accounted for 54%, and Leeds at 49%. Cycling proportion rules to 48% in Liverpool, while the lowest growth was for outer London (45%).
Leave a Reply