 (1)")
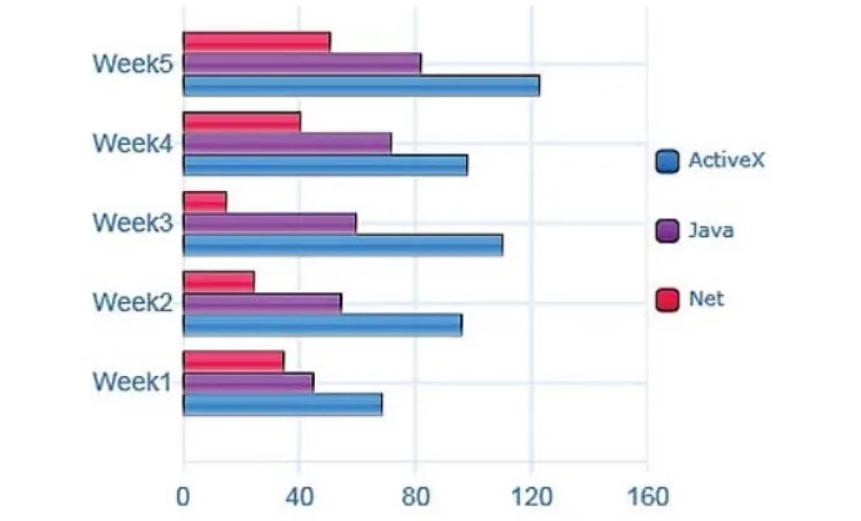
The bar chart shows the number of times per week (in 1000s), over five weeks, those three computer packages were downloaded from the Internet.
 Sample 1: The bar chart shows the number of times per week (in 1000s)
The bar graph illustrates the weekly rate at which ActiveX, Java, and Net were downloaded over a period of five weeks from the internet in thousands.
Overall, the highest download of all packages happened in week 5. ActiveX was the most frequently downloaded computer package throughout the weeks, while Net was the least installed software.
The number of times Net was copied from the internet fluctuated over the weeks. Initially, it decreases marginally over the first three weeks, then starts to increase from the 4th week until it reaches its peak at week 5, which is barely above 40 thousand times, an amount which is almost one-third of ActiveX download frequency in the same week.
ActiveX and Java downloads increased steadily through the weeks, with the exception of week 4, where there was an insignificant drop in the number of times ActiveX was downloaded. However, the download frequency of Java is lower than ActiveX, although slightly greater than Net.
Sample 2: The bar chart shows the number of times per week (in 1000s)
The bar graph illustrates information about three computer packages downloaded over seven days. There was a total of 5 weeks of data given and calibrated a number of times per week.
Overall, it is apparent from the very first glance that ActiveX was the highest downloaded program; in contrast, Net was the lowest-installed program.
Looking at the information in more detail, in which one is around 65 times more actively downloaded. Java was 45 Times, and the Net was around 30 times. Moreover, in the second week, ActiveX was escalated 35 times more than in week one and week 2, and in week four, active x was at the same time downloaded. In addition, in week 3, Java was sliced more than weak two. In the second week, the Net was 25 times; in the third week, it was downloaded 20 times.
Furthermore, Java was around 70 times installed, and the Net was exactly 40 Times installed. Additionally, in the 5th week, the number of active x was more than 120, which was the highest over the period. Java was sliced more than 80 times, and the Net was 55 times, respectively.
Sample 3: The bar chart shows the number of times per week (in 1000s)
The bar chart illustrates how many times downloaded three computer packages, namely Activex, Java, and Net, from the internet per week during five weeks.
Overall, ActiveX and Java show similar trends in the overtime period. Apart from this, ActiveX showed a decline in the second last week. While net software show fluctuation in the given time period.
To begin with, ActiveX and Java software illustrates the Same pattern in five weeks, but in week 4, ActiveX lost their download rate and came down to 100000. At the same time, a static growth was noted in the download of Java software, which started at 70000 in week one and reached 85000, an all-time high.
Moreover, net software was downloaded 30000 times in week 1, the lowest in the first week. The purchase from the internet in week 3 was half of that of the purchases in week 1. However, after week three net software downloaded rate dramatically increased and went up by 50000 weekly downloads.
Leave a Reply