")
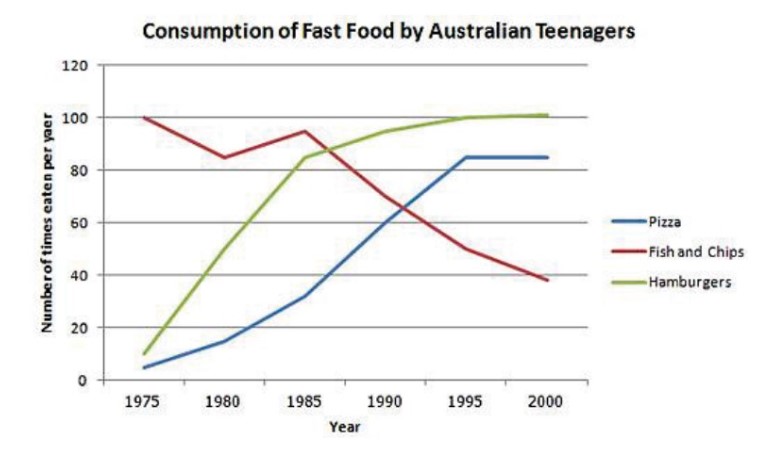
The line graph below shows changes in the amount and type of fast food consumed by Australian teenagers from 1975 to 2000.
 Sample 1: The Line Graph Below Shows Changes in The Amount and Type of Fast Food
The given line graph illustrates information about various types of junk food eaten by a juvenile in Australia in the year between 1975 to 2000.
Overall, it is apparent at first glance that hamburgers were highly consumed food. On the other hand, fish and chips sales show decline trend over the period.
Looking at the information in more detail, in 1975 Pizza was eaten five times per year, and in 1985 it hiked 27 numbers then, it surged the 1995 and stood at 82 times per year, and for the rest of the year, it was constant. Moreover, in the year 1975, hamburgers were around ten times for 12 months consumed by Australian juveniles. After that, consumption spiked to 1985, 85 times per year. In addition, they went up slowly to 1995 and reached a hundred, and they became stable in 1995 and 2000.
Furthermore, fish and chips consumption was 100 times for the year in 1975; it went down to 1980 and again showed a slice increase in 1985 and stood at almost 97, then conception showed a plunge throughout the period and in 2000, 39 per year eaten by children.
Sample 2: The Line Graph Below Shows Changes in The Amount and Type of Fast Food
The line graph shows the changes in fast food consumption by Australian teenagers in the period from 1975 to 2000. The Graph shows that in 1975 fish and chips had the highest number, but in 2000 it can be overtaken by hamburgers.
On the one hand, In 1975, fish and chips were eaten 100 times per year by Australian teenagers, but moving on to 2000, the market for fish and chips declined by the numbers of 40 times per year.
On the other hand, In 1975, pizza did not have that impact on the market; it was only eaten almost ten times per year, and pizza ended up a remarkable number, nearly 85 times per year in 2000. Moreover, hamburgers crossed all the boundaries in 2000, beat the other competitor, and crossed the 100 times per year mark in the fast food industry.
Leave a Reply