")
The table below gives information on the proportion of carbohydrates, protein and fat in three different diets. Write a report for a university lecturer describing the information shown below. Make comparisons where relevant.
 Sample 1:- The Table Below Gives Information on The Proportion of Carbohydrates
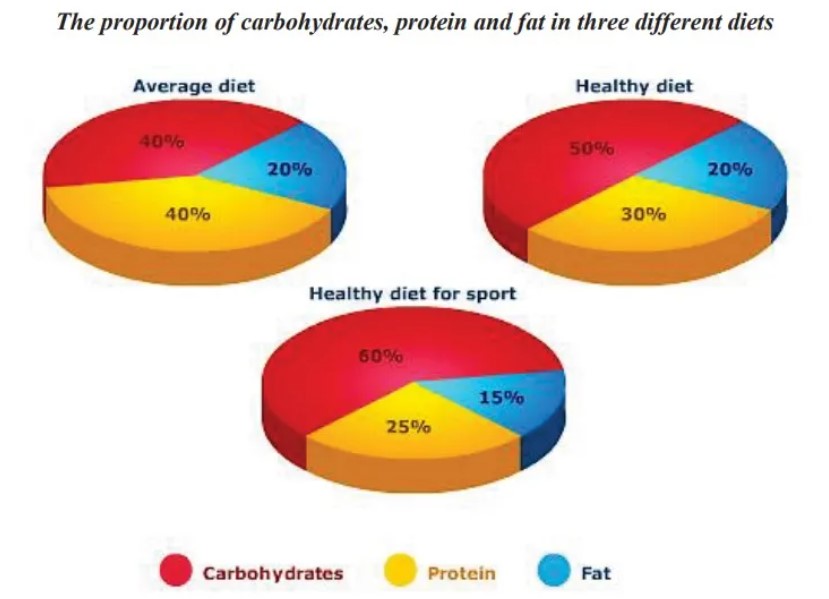
The table illustrates the proportion of Carbohydrates, Protein and Fat in three various types of diet like an average, healthy and healthy diet for sports.
From the given information it is readily apparent that Carbohydrates covered most of the part in every diet however Fat contained was less in contrast to other nutrients and intake of Protein was the same but slightly more in sporty people.
Carbohydrates were 40% in the average person’s diet whereas it rose by 10% in a healthy person’s diet (50%) and for sports person consumption of carbohydrates was more than half of the whole Nutrients with 60% highest in all types of diets. In contrast, Fat intake decreased in the diet of a sports person by 15 % while with 5% more in both a healthy person’s diet and an average person’s diet (20%).
However, the protein intake was highest in the average diet (40%). In contrast, it decreased by 10% in the healthy diet (30%) and again decreased by 5 % in the diet of sports people (25%)as consumption of everything is bad except carbohydrates.
Also, Read The Map Below Gives Information About a School in 2004 and The Change
Sample 2
The provided pie chart illustrates the percentage of various ingredients in the average diet healthy diet and healthy diet for sports person. Carbohydrates have the maximum percentage in every diet, while fat contains the lowest proportion.
Firstly, carbohydrates contain the major part in the healthy diet for sport, about 60 %, but it decreased and ends at 50 % and 40 % for the healthy diet and average diet respectively.
Apart from that, the graph witnesses the reverse trend for protein and fat. The healthy diet sports person consumes 25% protein, and it increased by 5% and 15% for the healthy diet and average diet person. Additionally, the fat eaten by an athlete is around 15%, while the average and healthy person eats 20% of the fat in their food.
Leave a Reply