")
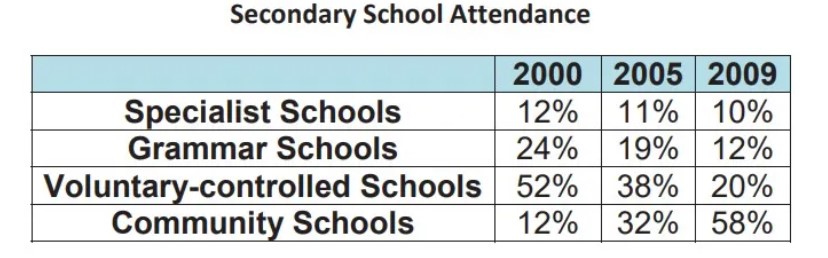
The table shows the Proportion of Pupils Attending Four Secondary School Types Between 2000 and 2009. Summarise the information by selecting and reporting the main points and give comparisons where relevant.
 Sample 1:- The table shows the Proportion of Pupils Attending Four Secondary School.
The table illustrates how many students attended four types of secondary school in the years and 2000,2005 and 2009. The data is given in percentages.
Overall, In the beginning, time the highest number of attendance was voluntary. In controlled schools, and the lowest number of attendance in specialist and community schools. While in the ending time period, the highest number of pupils attended community schools. However, few pupils attended specialist schools.
To begin with, In 2000,12% of students attended community schools. Moreover, the same percentage of students attended specialist schools. Grammar schools had 24% attendance, and voluntary controlled schools had above 50% students attend, which was highest in the year 2000. In addition, students attend specialist schools and grammar schools, 11% and 19%, respectively. Voluntary-controlled and community schools were the highest in 2005, 38% and 32%, respectively.
In addition, In 2009, students attended specialist schools, which was only 10%, which was 2% lower than grammar schools in the same year. Voluntary-controlled schools show a dramatic decline trend and end up with only 20%, while Community schools had 58% students attendance in 2010 which is an all-time high in four types of schools.
Sample 2:- The table shows the Proportion of Pupils Attending Four Secondary School.
The given table chart represents the information regarding the number of Scholars who attended four senior School types from the period of 2000 and 2009. Overall, it is crystal clear from the illustration that specialist schools were less preferable by children in all years.
Follow- Us on IELTSPlaza Pinterest
At a fleeting glance, it is noticeable that in 2000 more than half of the pupils preferred voluntary controlled schools, on the other side, 24% in the amount in the preference of Grammar School community. In the middle year, Scholars were less into specialist schools and really enjoyed attending voluntary controlled schools.
With regards to the last year,2009, special schools were less attended by students with the amount of 10% which was 2 and 1% more in 2000 and 2005 respectively. Moreover, community School type was more attended by students within the ratio of 58% in the year 2009.
Leave a Reply