")
The bar graph shows the global sales (in billions of dollars) of different types of digital games between 2000 and 2006. Summarise the information by selecting and reporting the main features, and make comparisons where relevant.
 Sample 1 The Bar Graph Shows the Global Sales (in Billions of Dollars)
The bar graph illustrates the trading of different types of digital games worldwide in 5 years, from 2000 to 2006. units are measured in billions of dollars.
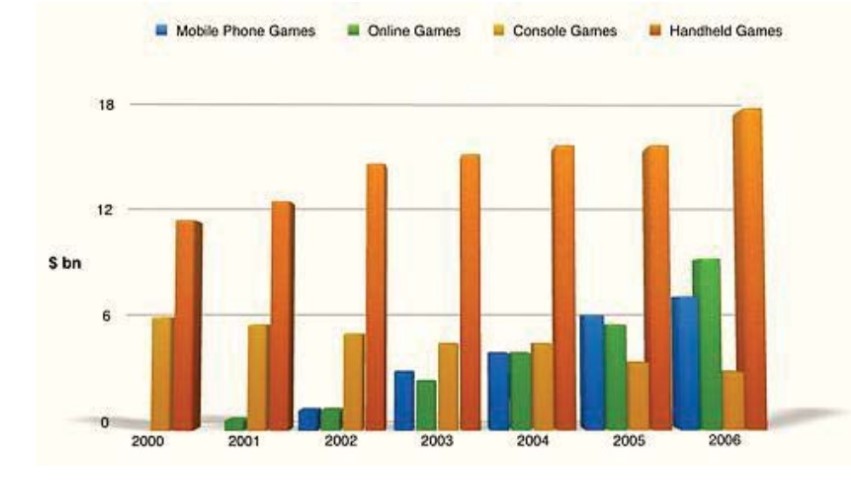
After looking at the overall perspective, it is readily apparent that handheld games were quite famous throughout the period, and sales also increased till the end, while Console games showed a gradual decline in this period; however, the remaining games kept on showing a positive trend at the end.
Handheld games did business almost 12 billion dollars in 2000, which kept on increasing gradually at reached approximately 16 billion dollars in 2004 And remained constant the next year but almost touched 18 billion dollars in 2006 and became the selling game in the world. In contrast, console games were the second most sold games in 2000 with nearly 6 billion dollars selling, but the craze for this dropped gradually, and sales remained at only half at the end of the period with just Nearly 3 billion dollars.
In 2000, mobile phone games and online games were not in trend, online games started to sell in 2001 with just below 1 billion dollars in sales, but still, mobile phones games did not come into existence even then, they started in 2002 with around 1 billion dollars almost same for games also, and it showed fluctuation throughout the period until the end when dealing of mobile games increased at nearly 7 billion dollars while online games became more popular by selling 2 billion dollars more online games (approx 9 billion dollars ) than mobile games.
Sample 2 The Bar Graph Shows the Global Sales (in Billions of Dollars)
The given bar chart illustrates information about sales of various games in the year between 2000 to 2006. The data was celebrated in billion of dollars.
Overall, it is apparent at first glance that handheld games were the highest-selling games over the period. On the other hand, console game use was decreased every year.
Looking at the information in more detail, handheld game sales had 11 million dollars in 2000, then it escalated over the period and stood at almost 80 billion dollars in 2006. In contrast, console game sales went down throughout the period in 2000, it was 6 million dollars and constant decrease and stood at 3 billion dollars in 2006.
In addition, online games seal started in 2001 at around 0.5 billion dollars, it Rose to around two billion dollars in 2003, and then in the year 2006, the sale was 10 million dollars. Furthermore, in 2000 and 2001, mobile phone games were not sold. The cell started in 2002 with around 1 billion dollars. The cell surged every year and almost 6 billion in 2006.
Follow us on Pinterest IELTSPlaza
Leave a Reply